A commissioning skyline shows which subsystems are due which week and whether they are ready. Kept in Excel, it is re-coloured by hand every week and it drifts. This guide replaces the drawing with a computation: you maintain one sheet, one row per subsystem, and the skyline draws itself with the status colour and the ITR progress bar on the same box. Nothing is installed, nothing is uploaded.
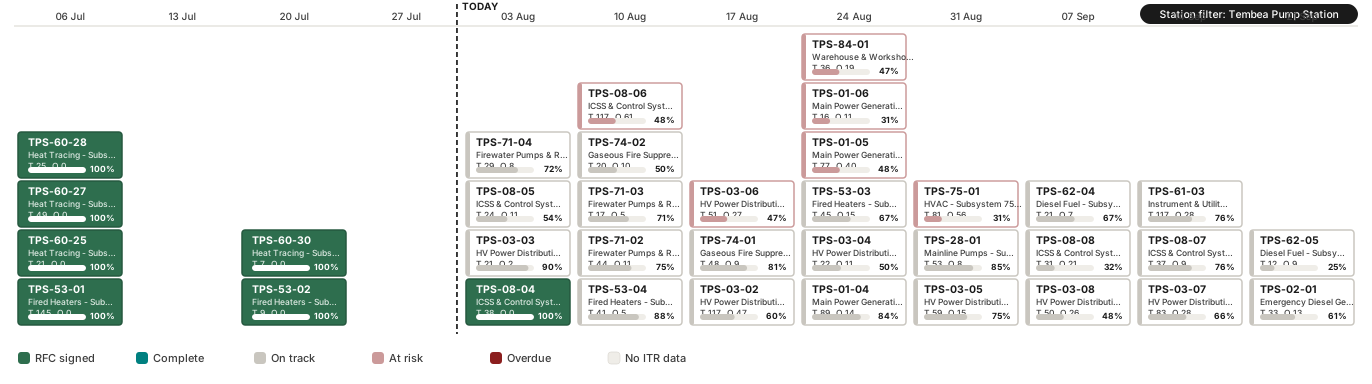
Part 1The web version
-
Download the template
Get Skyline_Input.xlsx (also behind the Download template button on the tool page). It ships with 500 sample rows so you can see the skyline before you type anything.
-
Fill the sheet, one row per subsystem
Keep the sheet name
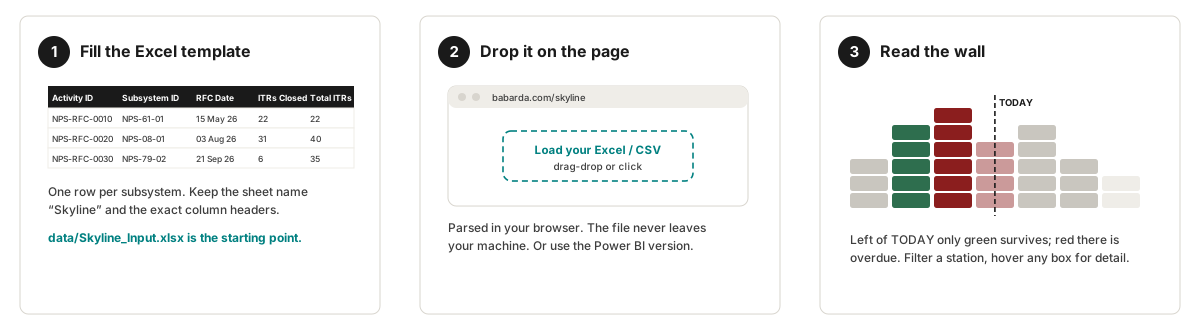
Skylineand the exact headers. Replace the sample rows with yours.Column What goes in it Activity IDThe RFC activity ID from your schedule (P6 or other). Ties the box to the line that moves it. Subsystem IDUnique subsystem tag. Printed on the box. Subsystem DescriptionFree text, shown on the box and in the tooltip. StationSite, plant or area. Drives the station filter. RFC DatePlanned RFC date. The skyline stacks by the week of this date. RFC Progress %Formula: ITRs Closed / Total ITRs. Leave it in place. ITRs ClosedInspection test records signed for the subsystem. Total ITRsAll inspection test records for the subsystem. The RFC date usually comes from the schedule export and the ITR counts from the completions database. Paste both in, the formula column recalculates. Do not type a status: it is computed.
-
Drop the file on the page
Open babarda.com/skyline and drag the file onto it. SheetJS parses the workbook in your browser; no request leaves the page. The headline recounts signed, overdue and at-risk for what you loaded.
-
Read the wall
Each box is one subsystem on its RFC week. The fill is the status, the bar is
ITRs Closed / Total ITRs.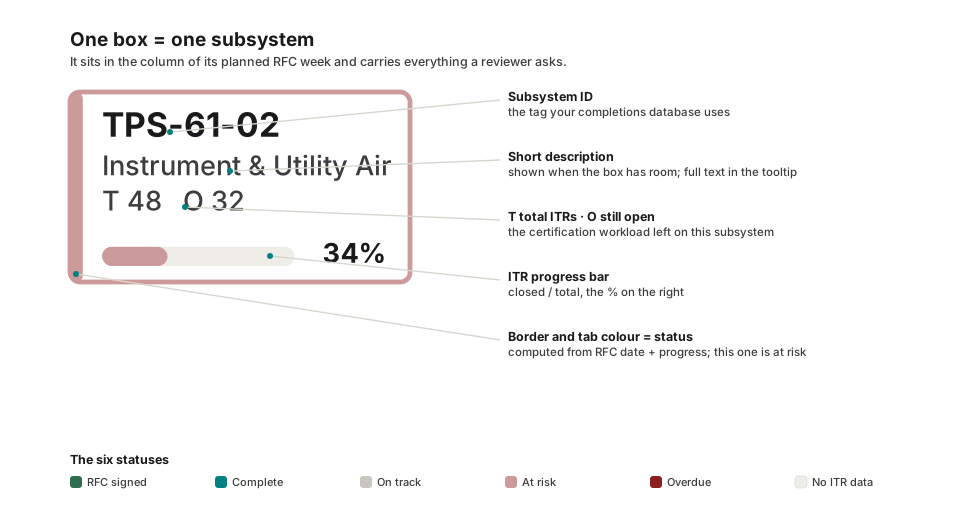
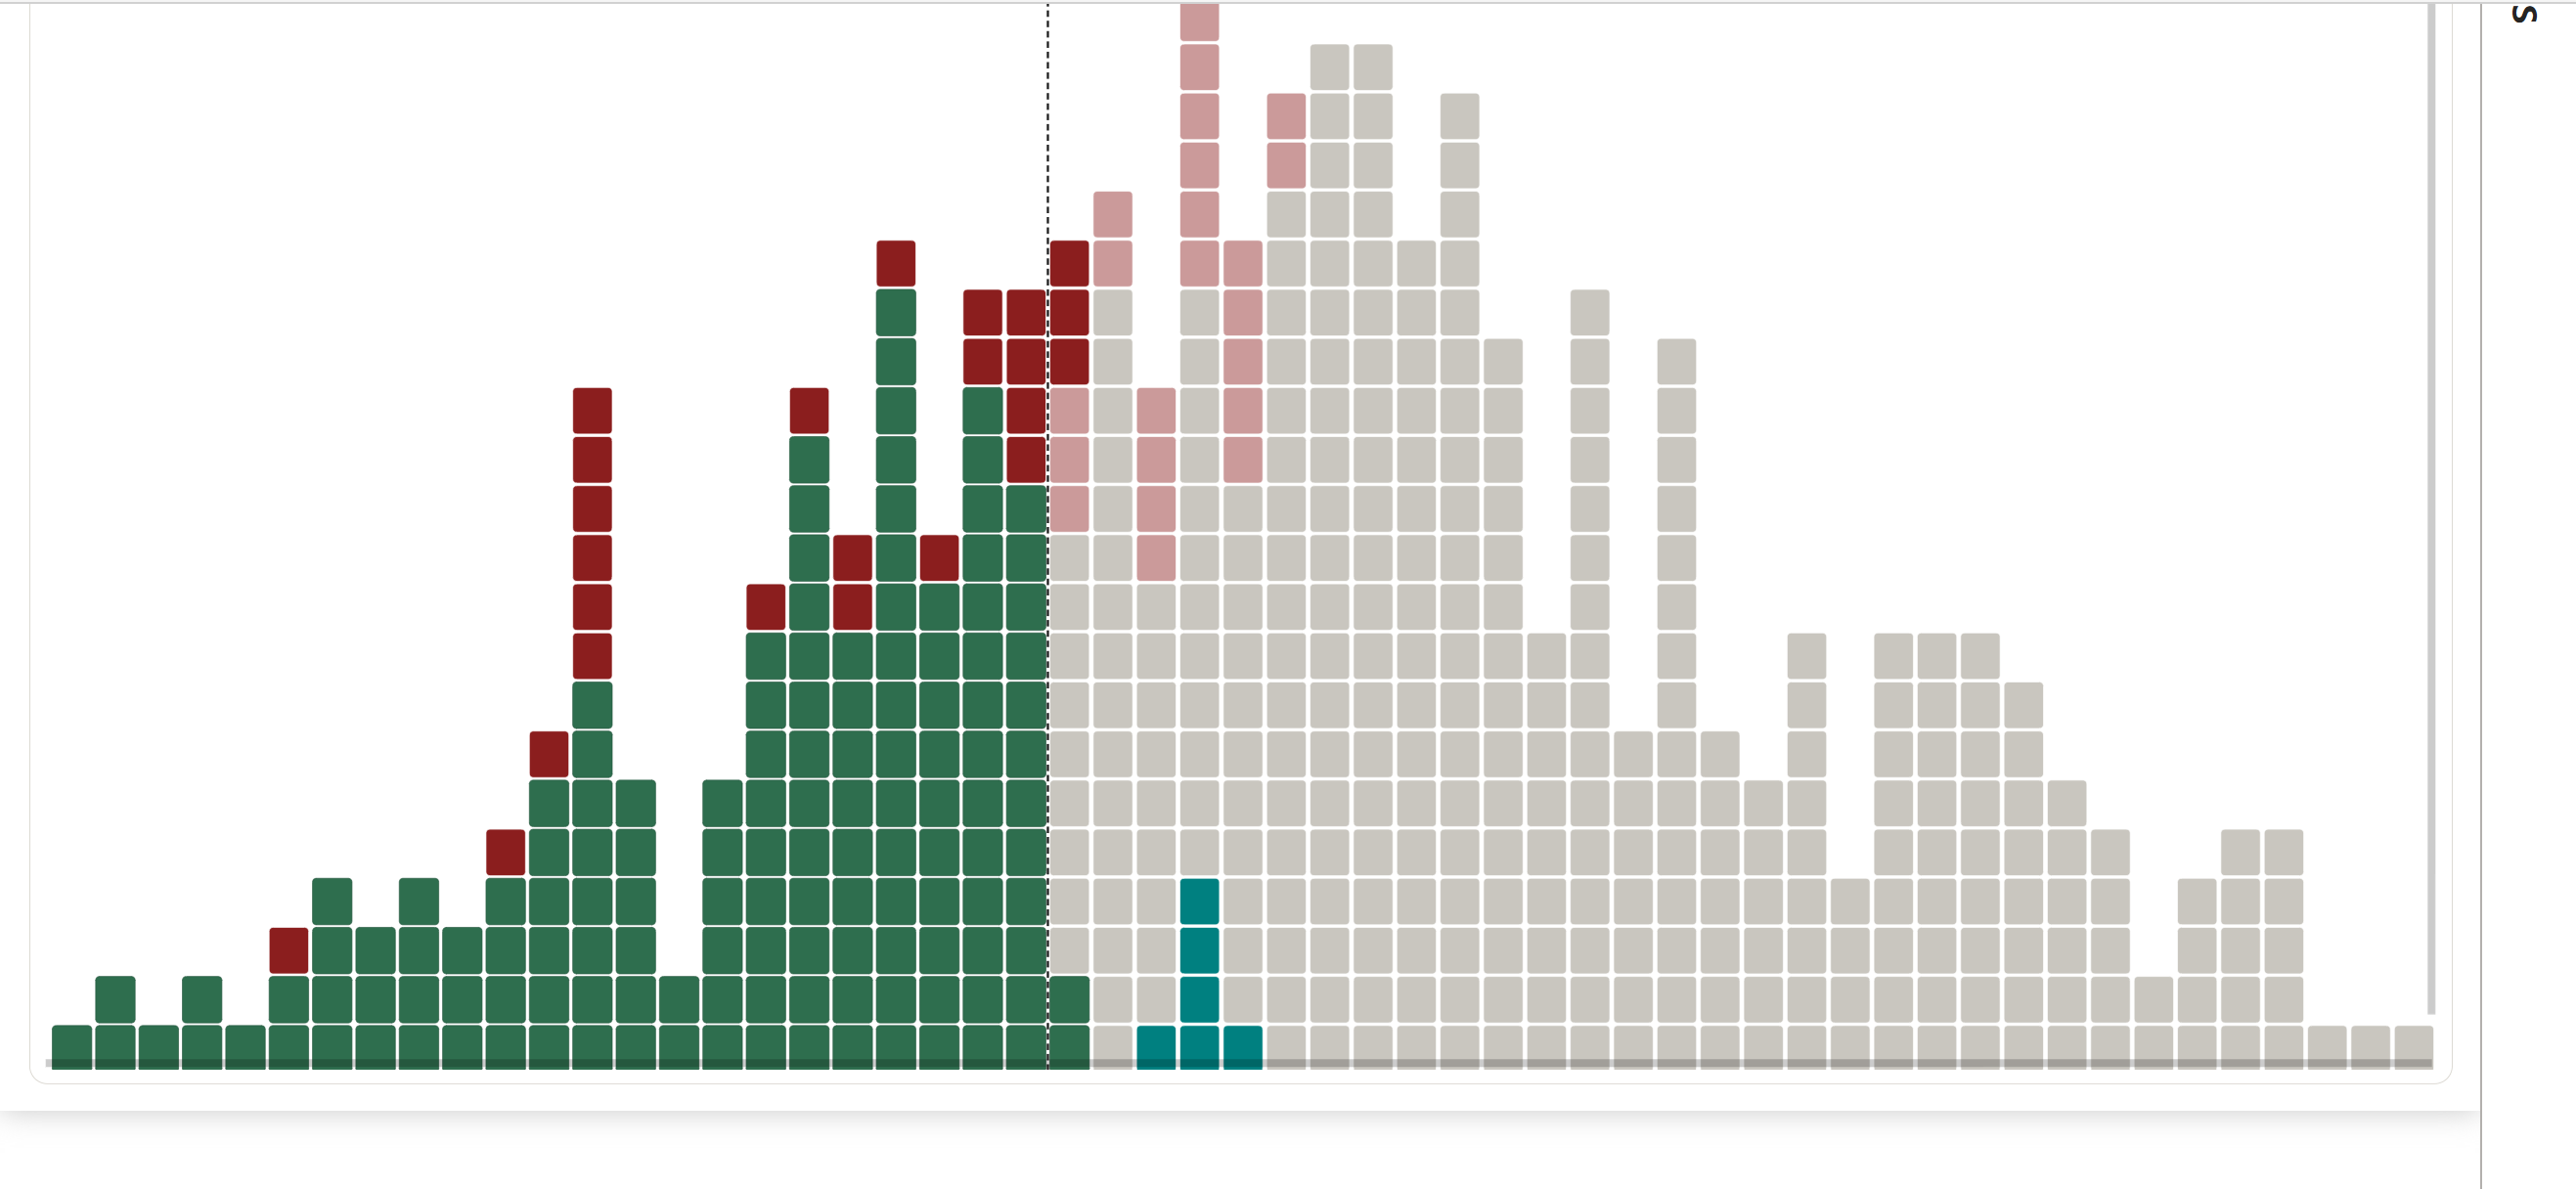
Status Rule RFC signed 100% ITRs closed and RFC date passed Complete 100% ITRs closed, RFC date still ahead On track everything else At risk RFC within 4 weeks and progress below 50% Overdue RFC date passed, ITRs still open No ITR data Total ITRs = 0 Reading rules: anything left of the dashed TODAY line that is not green is late. Pink inside the next month is where to spend your week. Click a station chip to filter; the headline follows.
-
Switch views
Detail (default) gives every box its ID, name, ITR count and bar, and the timeline scrolls sideways. Fit compresses boxes to colour tiles so the whole project sits on one screen. Use Fit to see the shape, Detail to act on it. Hover any box for the full tooltip: activity ID, station, dates, exact counts.
Part 2The Power BI version
The same Vega spec sits inside a Deneb visual, so the skyline cross-filters with a slicer like any native chart. The repo ships it as a Power BI project (PBIP: PBIR report plus TMDL model), which needs four steps the first time.
-
Download the whole
powerbifolderThe
.pbipfile is a 1 KB pointer. Desktop needs the two folders beside it:Commissioning Skyline.ReportandCommissioning Skyline.SemanticModel. Get the repository ZIP (green Code › Download ZIP on GitHub) and keep the three items together.Downloading the
.pbipalone givesReportDefinition: Required artifact is missingon open. -
Put the input file where the model expects it
The model reads
Skyline_Input.xlsxthrough a parameter namedFilePath, defaultC:\Skyline\Skyline_Input.xlsx. Either createC:\Skylineand save your file there under that name, or keep it anywhere and change the parameter in step 4. -
Install Deneb, once per machine
Insert › More visuals › From AppSource, search Deneb, Add. Without it the page shows an empty box asking for the visual.
-
Open, point, refresh
Double-click
Commissioning Skyline.pbip. Desktop shows two banners on first open, calculated columns need to be manually refreshed and some tables have incomplete or no data. That is normal: a project file carries no data until you refresh.If your file is not at the default path: Home › Transform data › Edit parameters, set
FilePathto the full path, OK. Then Home › Refresh. Both banners disappear and the skyline draws.Refresh fails with could not find the file whenever
FilePathno longer matches where the file is. Moved the folder? Repeat this step.
Part 3Adapting it
- Thresholds. The at-risk rule (4 weeks, 50%) is one
SWITCHinpowerbi/…/tables/Skyline.tmdland oneifchain inweb/index.html. Change both or they disagree. - Colours. One ordinal scale (
STATUS/COLORS) in each file. The defaults follow the OVP design language AGRAW: statuses on a positive-to-negative axis, one teal primary. - Detail floors. The Vega signals
detail,nameOn,tbOn,pctOndecide at which pixel width a box shows its text. Lower them to show text earlier.
Sample data loaded. Drop your own file to replace it.
Web tool, PBIP, template, README with every step above.